Plot of bootstrap simulation output for selection and misclassification bias
Source:R/plot.episensr.booted.R
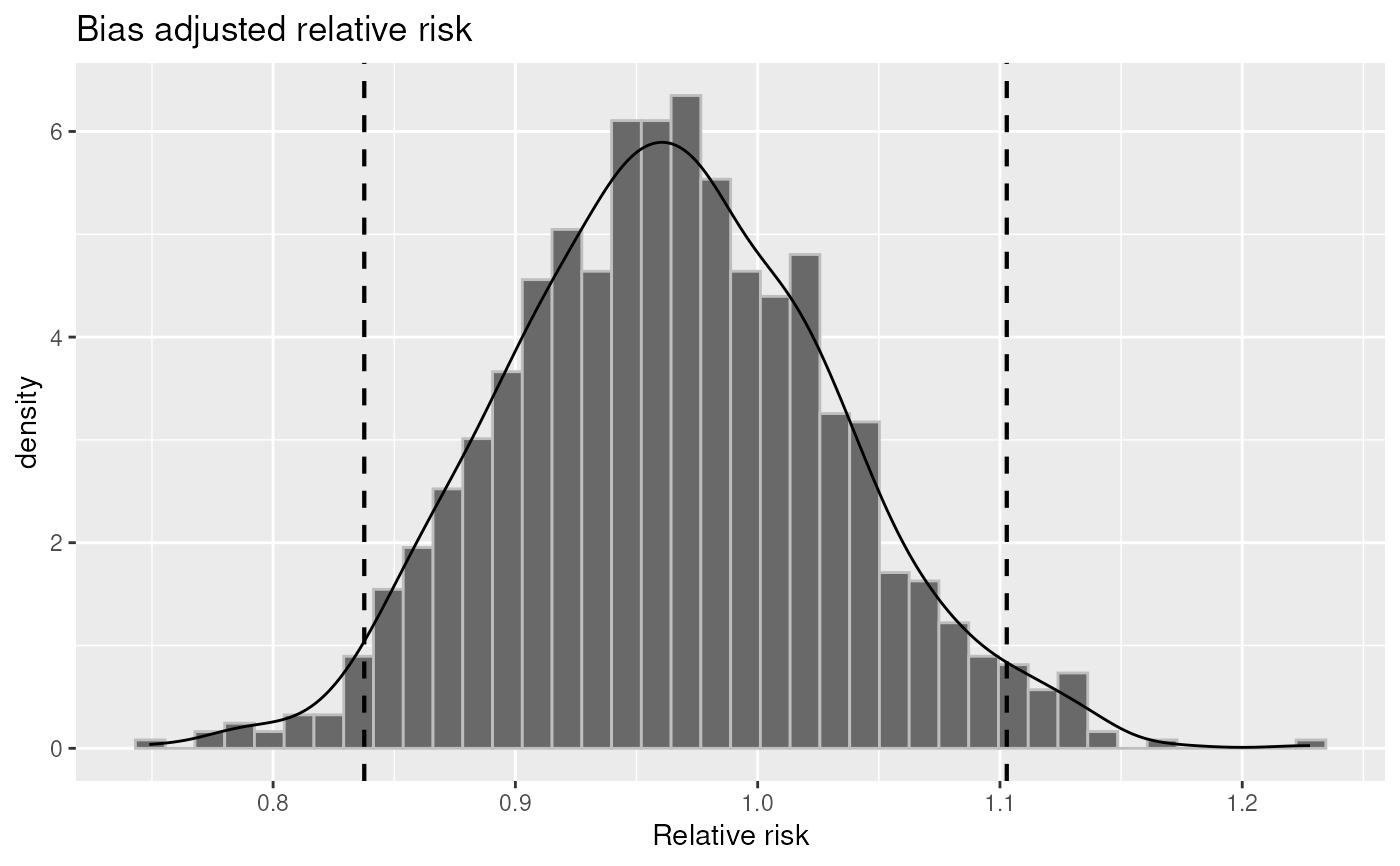
plot.episensr.booted.RdThis takes an episensr bootstrap object and produces the plot of bootstrap replicates for selection or misclassification bias of the variable of interest, either relative risk or odds ratio. It also draws the confidence interval.
See also
boot.bias, selection, misclass
Other visualization:
plot.episensr.probsens(),
plot.mbias()
Examples
misclass_eval <- misclass(matrix(c(215, 1449, 668, 4296),
dimnames = list(c("Breast cancer+", "Breast cancer-"),
c("Smoker+", "Smoker-")),
nrow = 2, byrow = TRUE),
type = "exposure",
bias_parms = c(.78, .78, .99, .99))

set.seed(123)
misclass_boot <- boot.bias(misclass_eval)
plot(misclass_boot, association = "rr")